theme: astronomy
theme: astronomy
the Orbits of Revolving Double Stars
1883
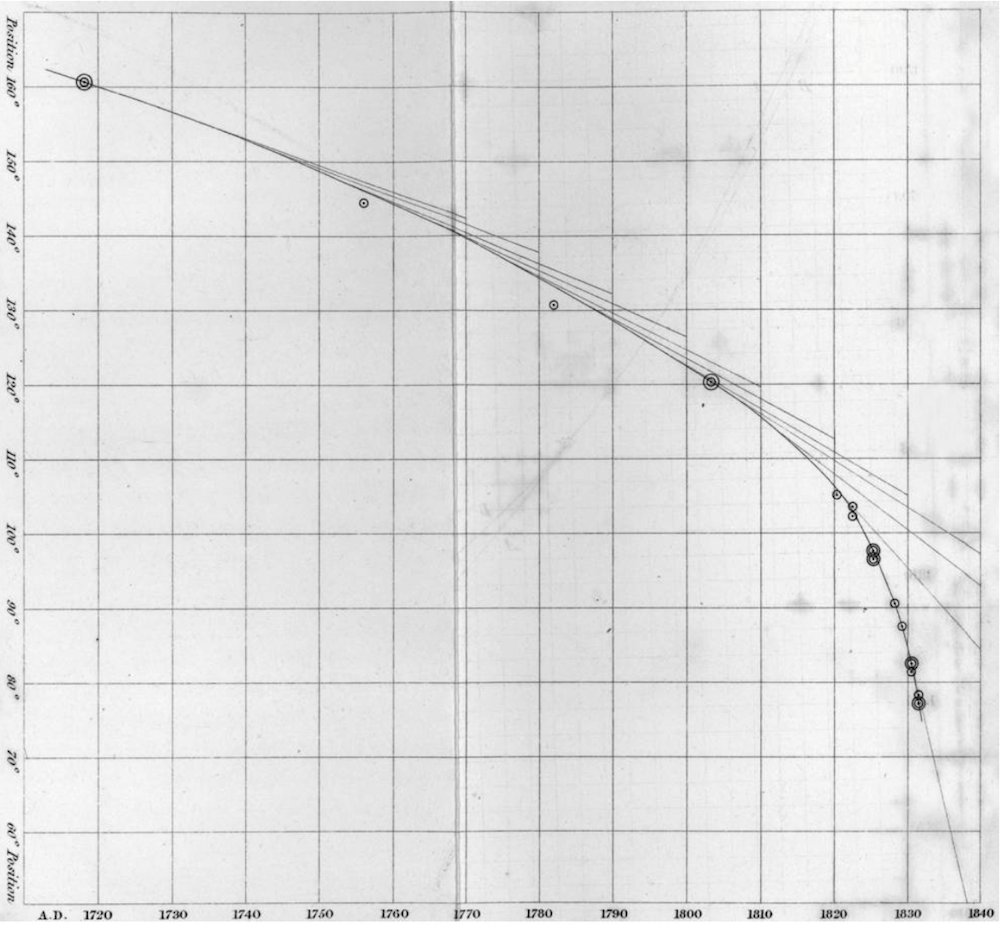
Figure 2. Herschel applies his graphical method to the double star γ Virginis. He plots the position angle against the time. The double circles are the more trustworthy observations. He draws the tangents, giving him the angular velocities at evenly spaced distances along the curve.
(Hankins, 2006)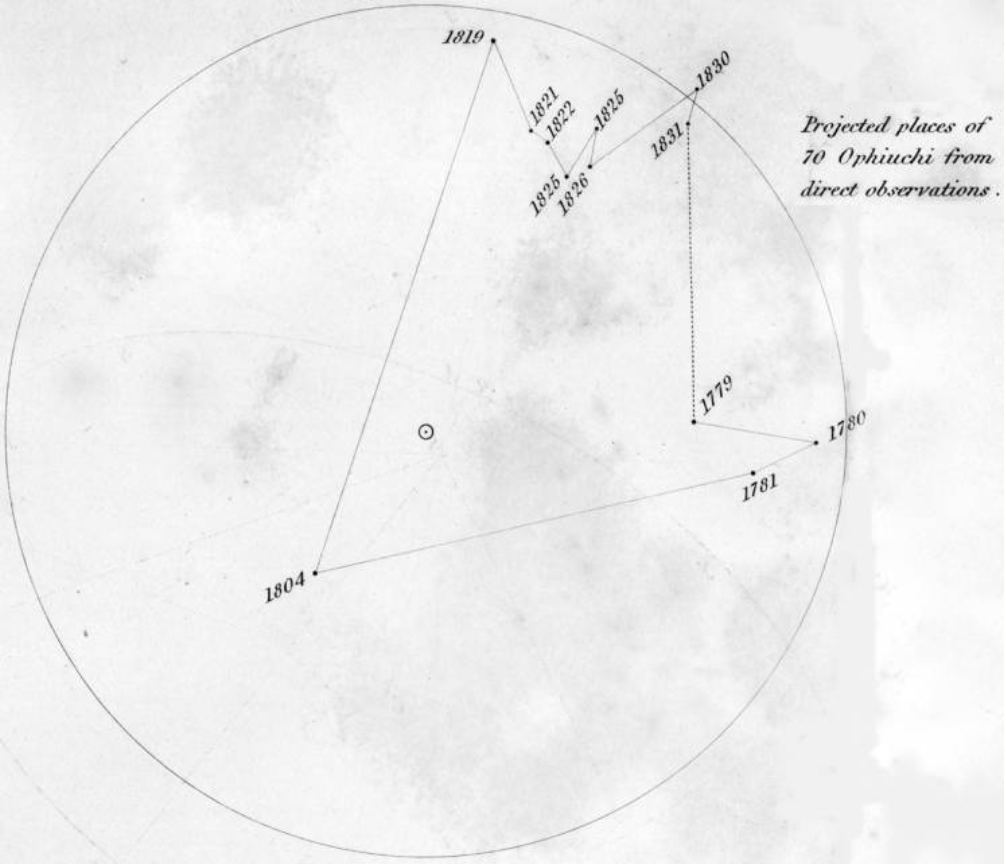
Figure 4. Herschel gives the data for 70 Ophiuchi from direct observation. There is no way to draw a reasonable ellipse through the data points.
(Hankins, 2006)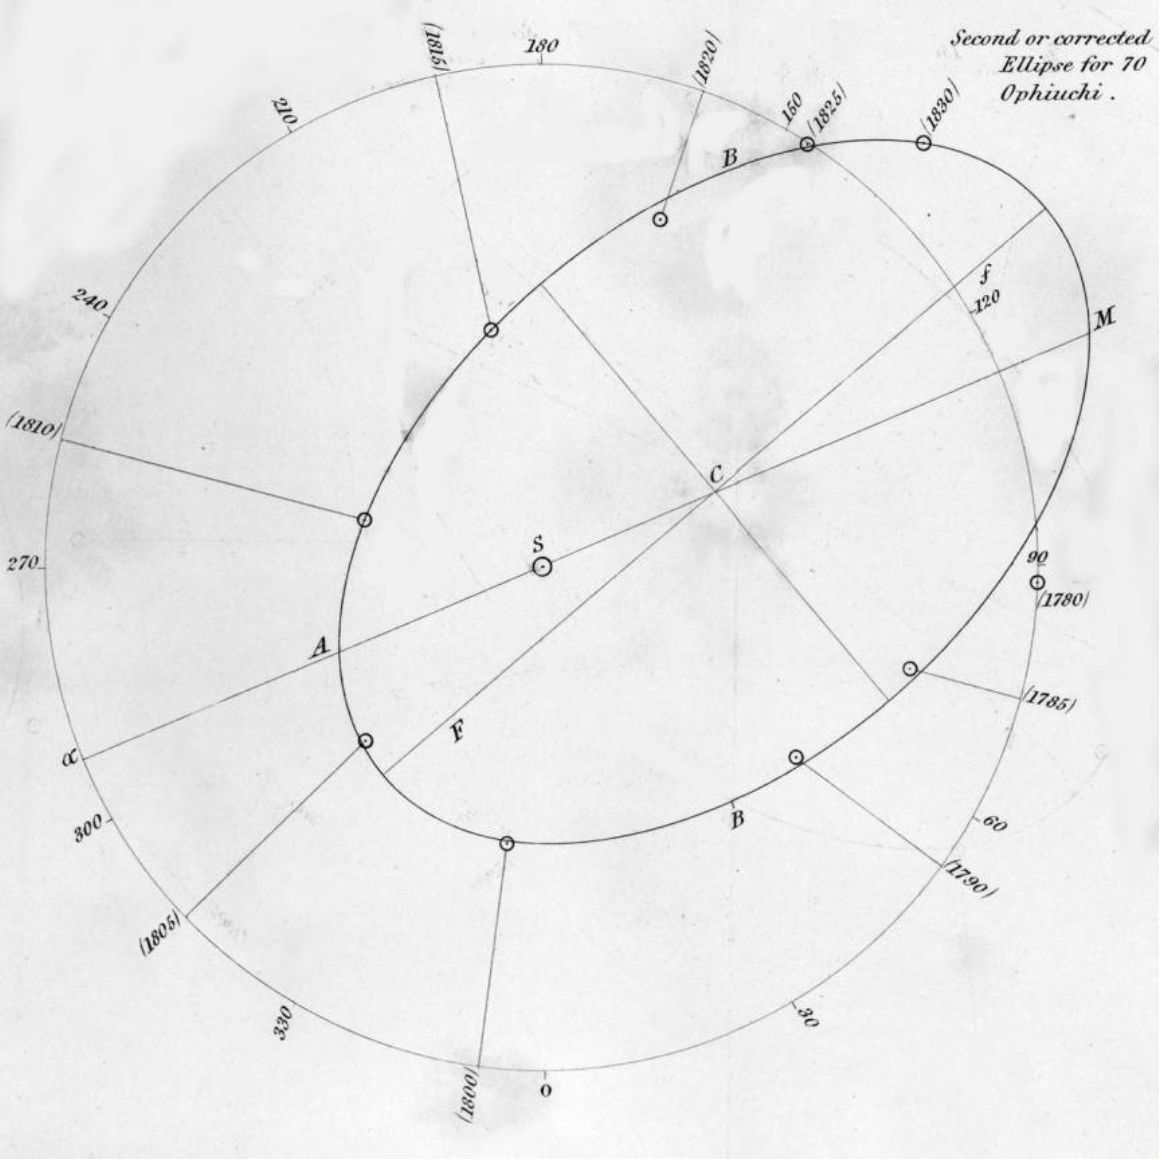
Figure 6. After adding a bit more sinuosity to his interpolation curve, Herschel obtains a near- perfect apparent ellipse for 70 Ophiuchi.
(Hankins, 2006)Herschel recognized that graphs provided a practical method for dealing with complex data. They allowed the natural philosopher to smooth out random errors of observation and fluctuations in the phenomena being observed. They also exposed order that would be concealed in a table of numbers. The process through which the mind recognized an order or law in observational data was crucial for the method of induction, much debated by Herschel and his colleagues.
(Hankins, 2006, p.606)This curve once drawn, must represent, it is evident, the law of variation of the angle of position, with the time, not only for instants intermediate between the dates of observations, but even at the moments of observation themselves, much better than the individual raw observations can possibly (on: an average) do.
(Herschel, 1833)Thus, a problem that had confounded astronomers and mathematicians for at least a century yielded gracefully to a graphical solution based on a scatterplot. As with Galton, the crucial steps were smoothing the raw observations and understanding a theory by which the smoothed relation could go far beyond his 14 data points.
(Friendly & Denis, 2005)Friendly, M. and Denis, D. (2005) ‘The early origins and development of the scatterplot’, Journal of the History of the Behavioral Sciences. Wiley, 41(2), pp. 103–130. [link]
Hankins, T. L. (2006) ‘A “Large and Graceful Sinuosity” John Herschel’s Graphical Method’, Isis, 97(4), pp. 605–633. [link]
Herschel, J. F. W. (1833) “On the Investigation of the Orbits of Revolving Double Stars: Being a Supplement to a Paper Entitled ‘Micrometrical Measures of 364 Double Stars &c, &c,’” Memoirs of the Royal Astronomical Society, 5:171–222.
theme: astronomy
theme: astronomy