1990 - Multi-dimensional data analysis parallel coordinates
theme: n-dimensional_gaze
theme: n-dimensional_gaze
t-SNE
2008
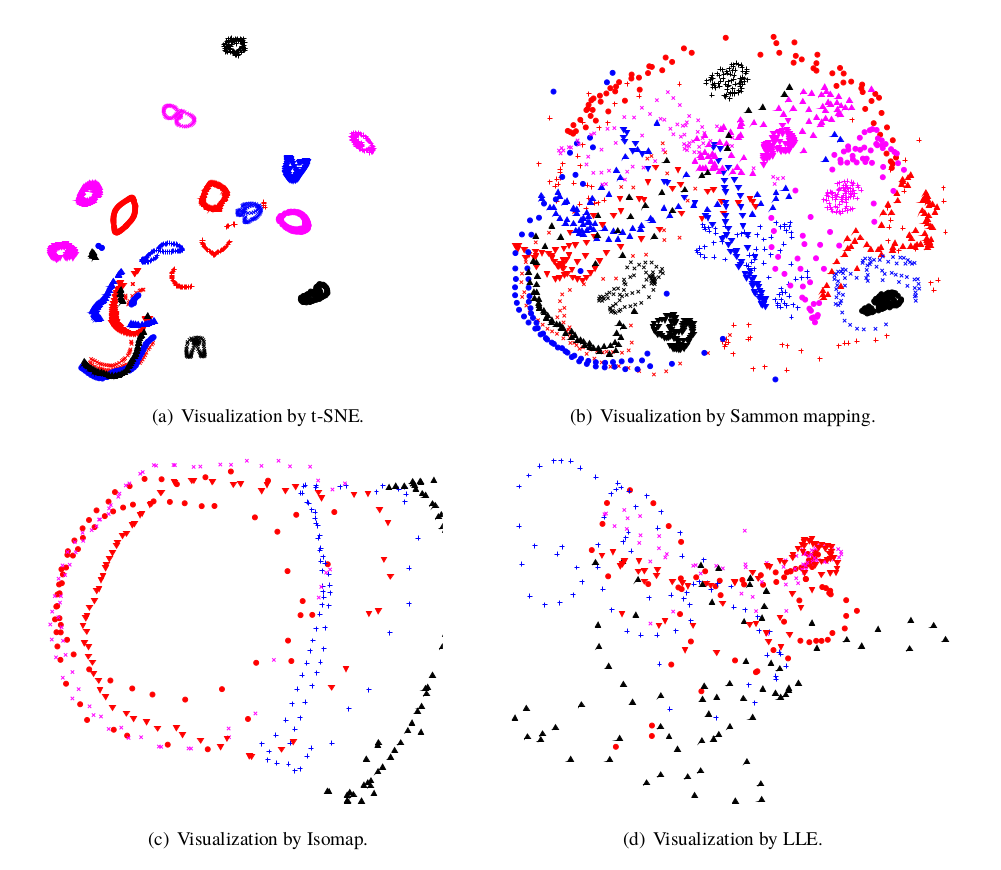
Visualizations of the COIL-20 data set.
(Maaten and Hinton, 2008)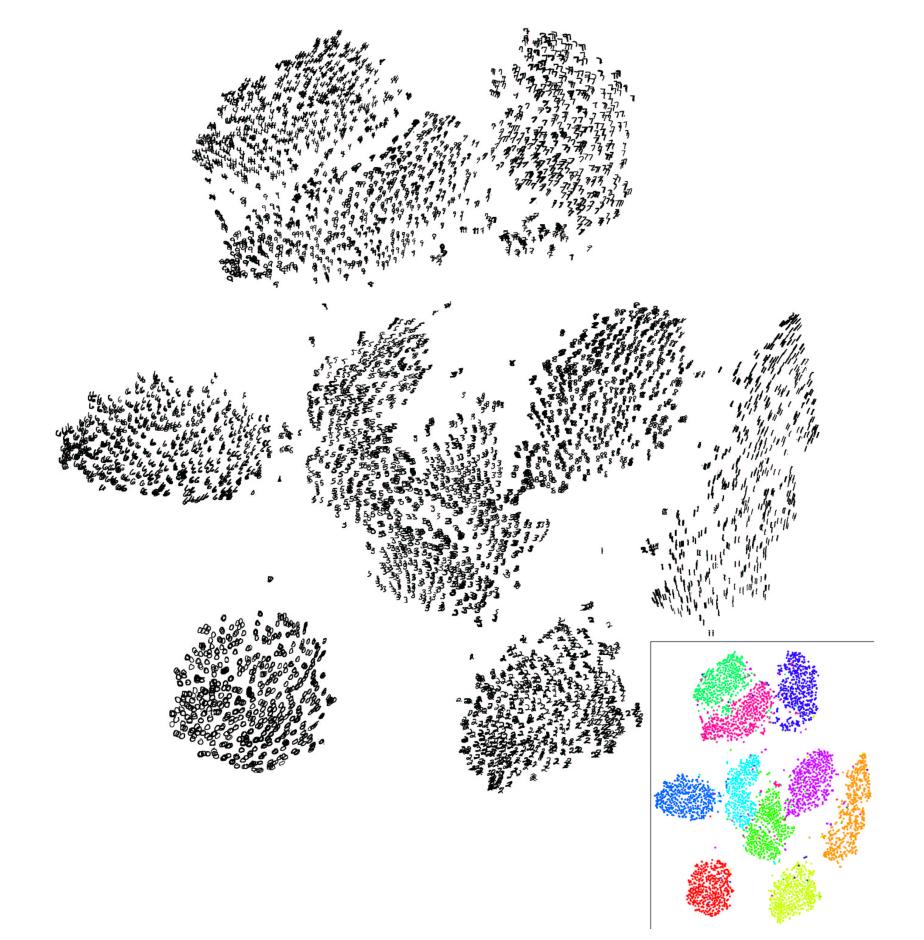
Visualization of 6,000 digits from the MNIST data set produced by the random walk version of t-SNE (employing all 60,000 digit images).
(Maaten and Hinton, 2008)Maaten, L. van der and Hinton, G. (2008) ‘Visualizing data using t-SNE’, Journal of machine learning research, 9(Nov), pp. 2579–2605.
1990 - Multi-dimensional data analysis parallel coordinates
theme: n-dimensional_gaze
theme: n-dimensional_gaze