theme: dashboard_governance
London Dashboard
2012
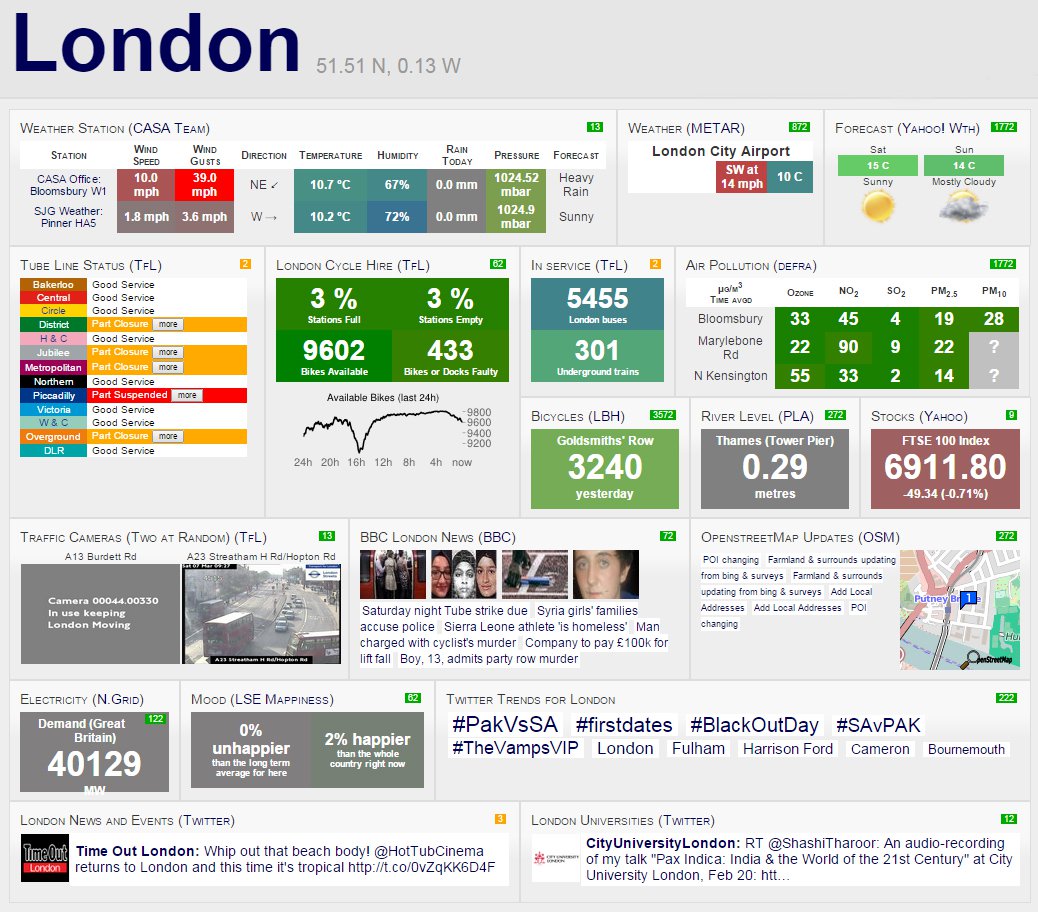
City Dashboard, London. 2012-present, by The Bartlett Centre for Advanced Spatial Analysis
Viewers can scan across data streams, zoom out to get the big picture, zoom in to capture detail; and this flexibility, as Kitchin and colleagues write, improves “a user’s ‘span of control’ over a large repository of voluminous, varied and quickly transitioning data … without the need for specialist analytics skills.” However, while the dashboard’s streamlined displays and push-button inputs may lower barriers to entry for users, the dashboard frame — designed, we must recall, to keep out the mud — also does little to educate those users about where the data come from, or about the politics of information visualization and knowledge production.
(Mattern, 2015)Mattern, S. (2015) ‘Mission Control: A History of the Urban Dashboard’, Places Journal. [link]
theme: dashboard_governance