theme: n-dimensional_gaze
theme: n-dimensional_gaze
PRIM-9
1974
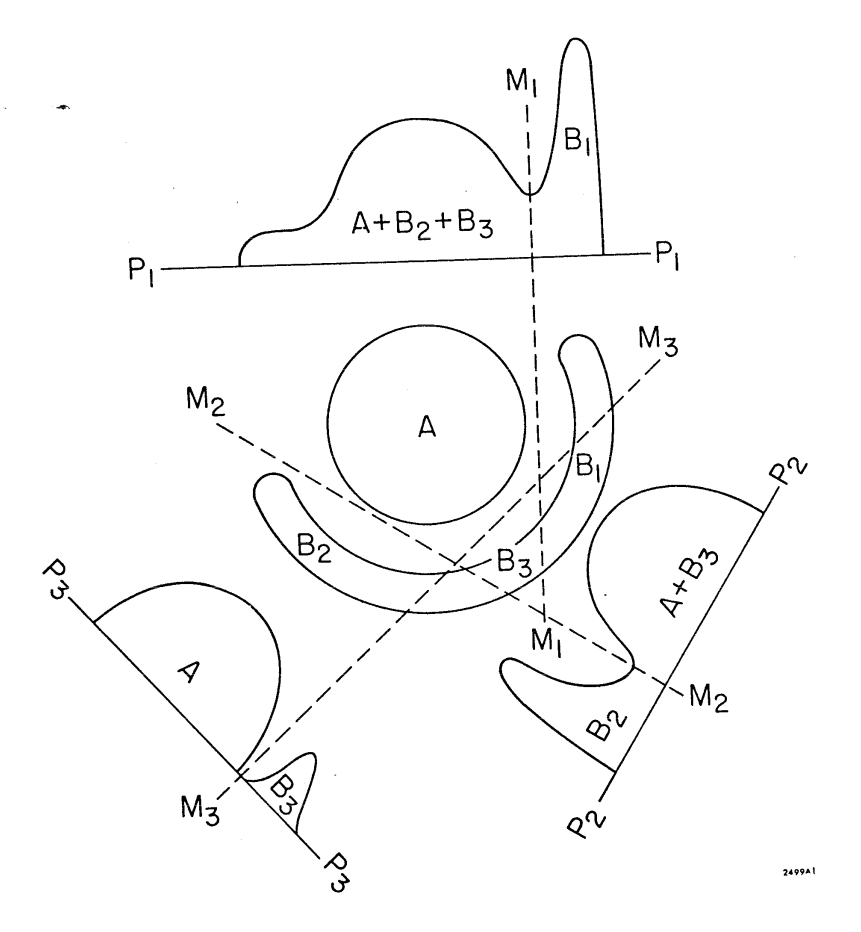
It is the presence of isolation in conjunction with rotation that gives the system its piecewise linear capability. This is easily demonstrated by considering the simple example of a two-dimensional data set, consisting of two classes whose boundaries are outlined in Figure 3. Clearly, there is no single one-dimensional discriminant direction that can completely separate the two classes (A and B = B1 + B2 + B3)- Applying rotation (both manual and automatic), the user might find a projection that achieves a good partiel separation (such as P, in Figure 3). Using this projection, a mask is constructed at M~1~ and the B~1~ sample is isolated from its complement A + B~1~ + B~3~- These two isolates are then rotated separately, searching for further structure.
(Fisherkeller, Friedman and Tukey, 1988)Fisherkeller, M. A., Friedman, J. H. and Tukey, J. W. (1988) ‘PRIM-9: An interactive multidimensional data display and analysis system’, Dynamic Graphics for Statistics, pp. 91–109. Available at: [link]
Friendly, M. and Denis, D. (2005) ‘The early origins and development of the scatterplot’, Journal of the History of the Behavioral Sciences. Wiley, 41(2), pp. 103–130. [link]
theme: n-dimensional_gaze
theme: n-dimensional_gaze